Land Use / Land Cover (LULC) mapping gives organizations a clearer view of how land is being used and how that use is changing over time. In modern cities, where urban growth, tourism, agriculture, infrastructure development, and climate pressures are reshaping the landscape, reliable LULC intelligence can support better planning, investment screening, environmental monitoring, and public-sector decision-making. In this demonstration, PERIOPSIS combines high spatial resolution satellite imagery with AI-empowered computer vision analytics to produce a consistent, picture of LULC across Cyprus. The demo covers the island’s diverse terrain, from dense urban areas and agricultural zones to Mediterranean forests, semi-arid regions, and coastal environments, being compatible with the CORINE Land Cover (CLC) classification scheme used across Europe.
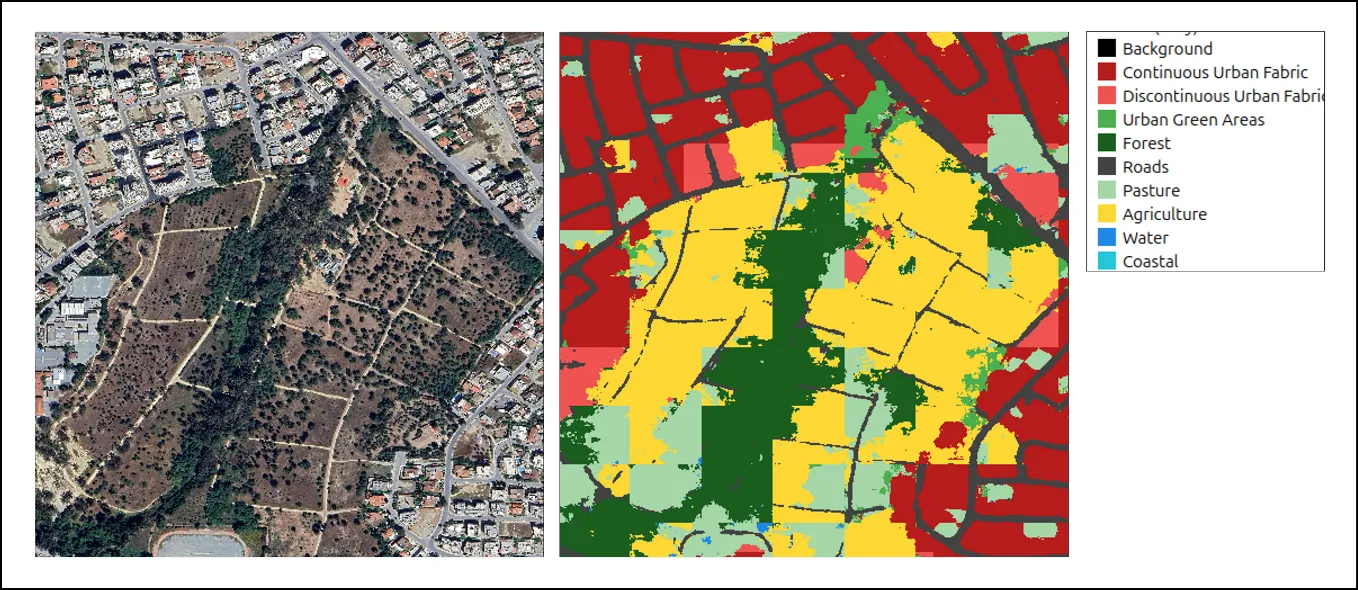
Figure 1: Example pairs of satellite images and corresponding segmentation maps showing how the model translates imagery into land cover classes.
To build a robust production workflow, we followed a multi-round training strategy focused on improving map quality while controlling annotation effort. The project started with the creation of a reliable baseline dataset built from thousands of carefully selected satellite images, representing diverse land cover types across Cyprus. Modern, clever techniques for efficient data annotation were employed, including class balancing and iterative annotation with feedback loops were employed. This first step gave PERIOPSIS a strong foundation for model development and quality control.
This initial dataset was used to train a baseline deep learning model to recognize the spatial and spectral patterns associated with each LULC class. Once this first model was in place, PERIOPSIS introduced more sophisticated annotations based on active learning, to improve the weaknesses of the baseline model. Rather than annotating new imagery at random, the team prioritized the samples where the model was least confident. This active learning technique is called uncertainty/confidence scoring. Repeating this cycle over several rounds improved performance where it mattered most while reducing unnecessary labeling effort. Land cover classification began with seven primary categories: Urban, Agriculture, Pasture, Forest, Road, Water, and Coastal.
Afterwards, these seven primary categories were refined into more detailed subclasses aligned with the CORINE Land Cover (CLC) system, to make the LULC model more aligned with international planning and reporting standardized workflows. This step was important as it transformed our LULC service from a technically sound segmentation AI model to a powerful land cover mapping product, which can be easily utilized by municipalities, region planners, utilities, environmental teams, and other stakeholders, who need standardized land information for planning and reporting. Refined classes are listed in the table below:
|
Sl No |
Initial Classes |
CORINE Schema Subclasses |
|
1 |
Urban |
Continuous urban fabric, Discontinuous urban fabric, Green urban areas, Port areas, Airports, Sport and leisure facilities |
|
2 |
Forest |
Forest, Burnt area |
|
3 |
Water |
Water bodies, Sea and ocean |
|
4 |
Agriculture |
Agriculture |
|
5 |
Pasture |
Pasture |
|
6 |
Road |
Road |
|
7 |
Coastal |
Coastal |
Table 1: Mapping of the seven primary LULC classes to their corresponding CORINE Land Cover (CLC) class schema.
The refinement stage was supported by PERIOPSIS geospatial workflows and its geospatial intelligence algorithms. Rule-based spatial criteria and class-mapping logic were used to translate the initial seven classes into more elaborate CORINE-compatible subclasses, helping the final map better reflect local conditions and operational needs across the demo’s geographical area. The rules used are listed in the table below.
|
Basic class |
New Classes |
Rule applied |
|
Urban |
Continuous Urban Fabric |
More than 80% of the land is classified as urban (CORINE), based on 100 m² land coverage units. |
|
Urban |
Discontinuous Urban Fabric |
Less than 80% of the land is classified as urban (CORINE), based on 100 m² land coverage units. |
|
Urban |
Green Urban Areas |
Must be within or adjacent to urban fabric. |
|
Water |
Water bodies |
The water class appears within the periphery of the island. |
|
Water |
Sea and ocean |
The water class appears within the periphery of the island. |
|
Coastal |
Coastal |
10 m buffer zone inland from the sea boundary. |
Table 2: Mapping of the seven primary LULC classes to their corresponding CORINE Land Cover (CLC) subclasses using rule-based refinement.
In regard to performance, while the baseline AI model established a strong baseline for LULC mapping and confirmed that high spatial resolution satellite imagery can be used effectively for this type of large-scale analysis, the final AI model, enhanced with modern annotation techniques and geospatial intelligence, reached performance which is considered state-of-the-art and even beyond. Analytically, performance based on common metrics used in LULC modelling is listed in the table below:
|
Model |
Precision |
Recall |
IoU |
|
Baseline AI Model |
61% |
61% |
52% |
|
AI model after active learning and geospatial intelligence techniques |
79% |
77% |
72% |
Table 3: Evaluation results of the 7-class LULC model across the testing dataset.
Compared with the baseline model, the final model showed clearer separation between similar classes and produced a more reliable map for operational use in commercial real-world applications. These results matter because they indicate that the final LULC model can support decisions with greater consistency, especially in applications where land classification quality directly affects downstream analysis. The confusion matrix below further explains per-class performance of the final AI model. The highest confusion appears between the following classes: Agriculture and Pasture; Agriculture and Forest; Pasture and Forest. This confusion is due to seasonal vegetation transitions and mixed landscapes, and it could be reduced in the future by employing other techniques such as:
- Multi-season, multi-spectral satellite imagery
- Further ncreasing annotated samples for difficult classes through active learning.
- Exploiting local knowledge derived from local databases and repositories.
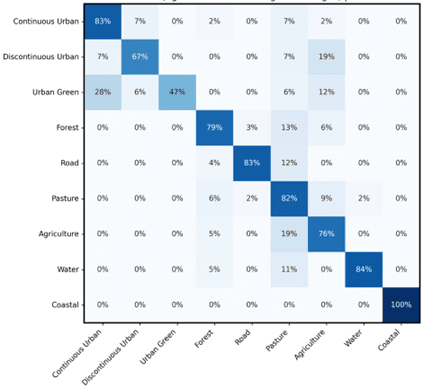
Figure 2: Confusion matrix for the final AI model’s output.
Overall, reliable LULC mapping can support better decisions for municipalities, planners, infrastructure operators, utilities, environmental authorities, investors, and local communities. Such maps can provide a clear spatial view of how land is being used across some geographical areas, helping stakeholders identify growth patterns, assess development potential, monitor sensitive areas, prioritize interventions, and compare locations more efficiently. For organizations working with land-related decisions, this kind of intelligence can reduce uncertainty and speed up analysis. This project shows how PERIOPSIS turns AI and remote sensing into practical geospatial intelligence for Cyprus. Beyond producing a high-quality LULC map, the project established an end-to-end workflow that includes data preparation, AI model training, data annotation, rule-based refinement via geospatial intelligence, and validation. As development continues, the methodology can be further strengthened through multitemporal imagery, smarter annotations, and ongoing refinement of the classification rules. The long-term objective is to deliver a robust and scalable LULC capability that supports sustainable development, smarter planning, and more informed public- and private-sector decisions across the globe.