
Trees Detection

Reliable insights for sustainable ecosystems

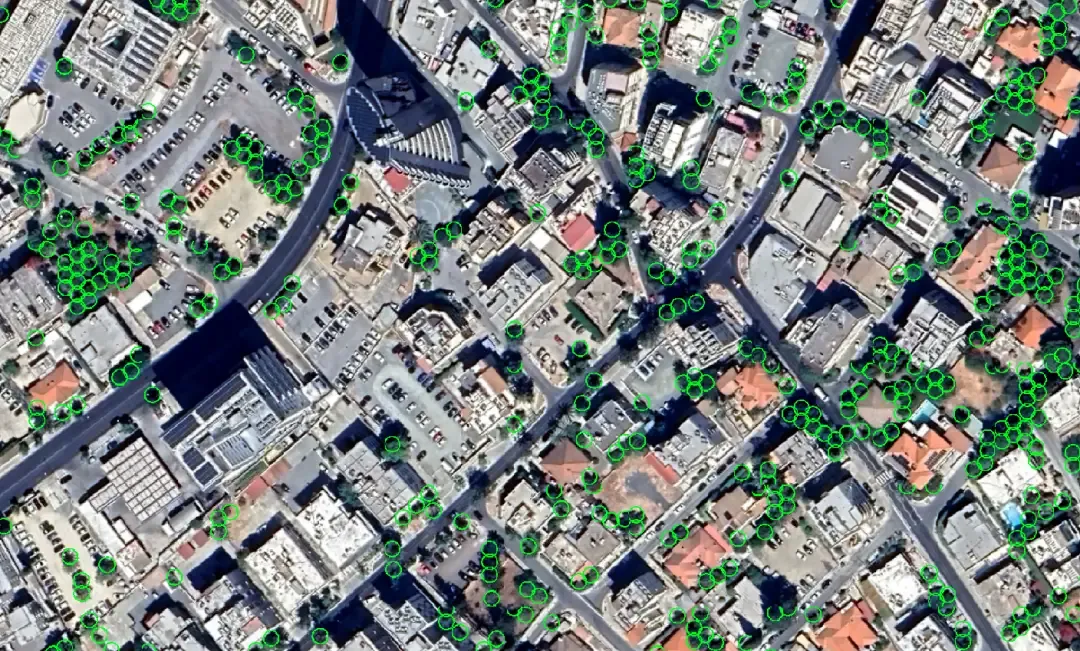
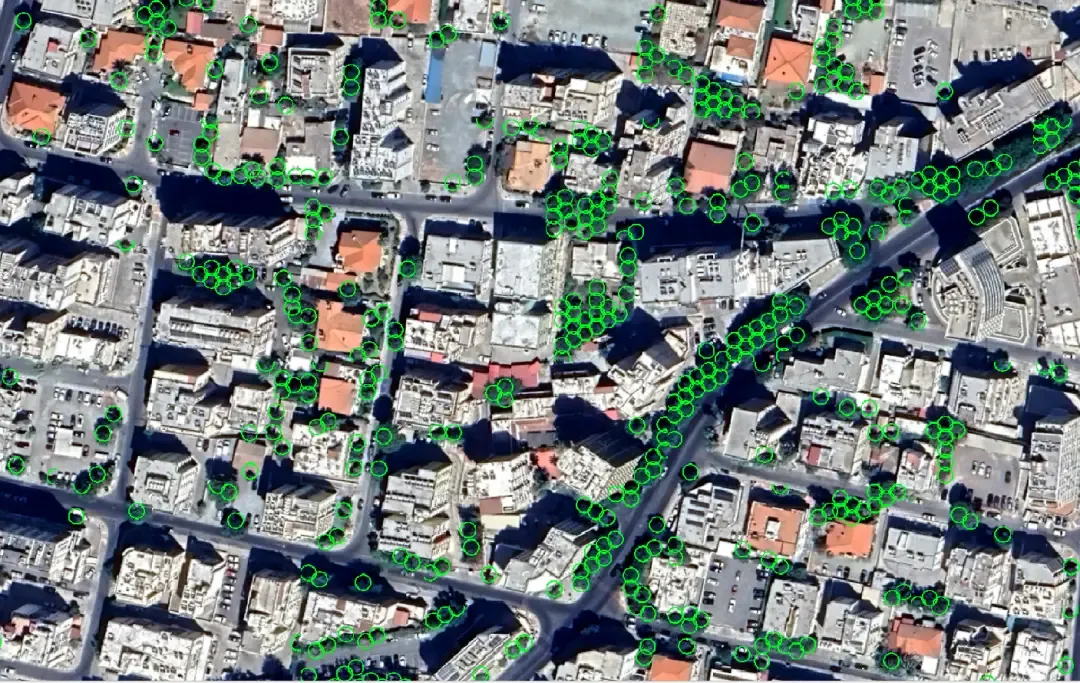
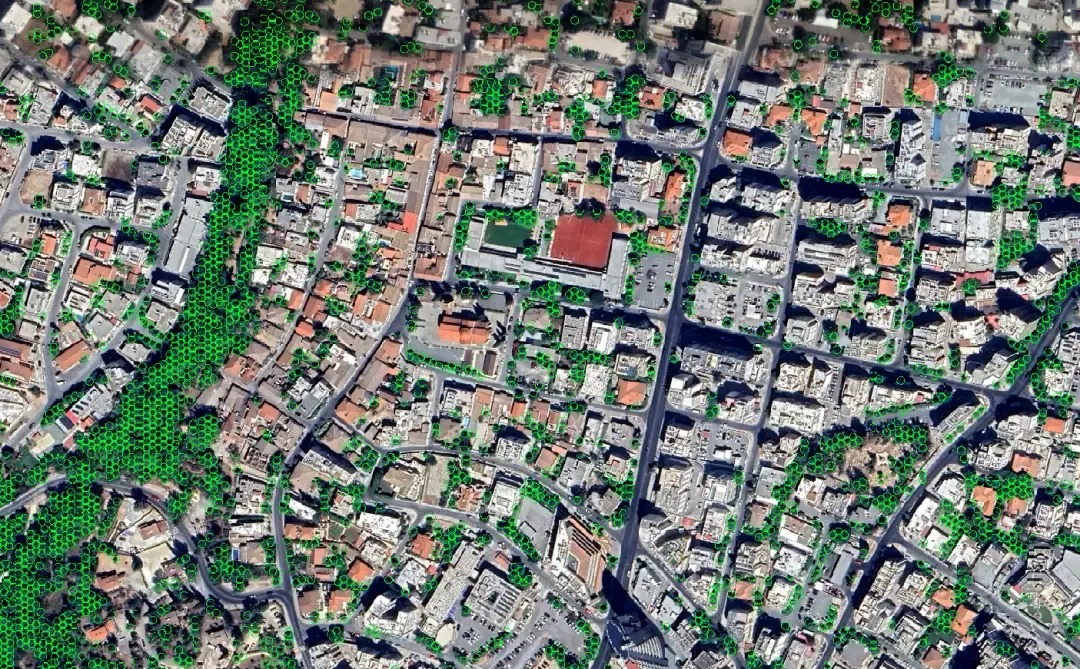
Our Trees Detection service allows to detect all trees inside the geographical area under study (area of interest, AOI) based on their canopy from high spatial resolution satellite imagery, using advanced, state-of-the-art proprietary AI models, developed by PERIOPSIS.

Access analytics powered by emerging technologies
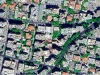
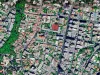
Satellite Imagery

High spatial resolution satellite imagery, @0.3-0.5 meters/pixel, capable of detecting smaller to bigger trees.

Artificial Intelligence

Proprietary AI models trained on extensive datasets to detect trees with high precision and recall (80-87%).

Validation geographic area: Island of Cyprus (9,000 square kilometers)

Output: Map of all trees as a GIS layer

FAQs

How accurate is the detection of trees?

Our Trees Detection service can detect trees with high precision and recall (80-87%). You can check our blog where we describe our service and its overall performance. We consider our results as state-of-the-art, considering both research and commercial competition.

What is the minimum tree size you can detect?

Our models reliably detect trees whose canopy diameter is equal or greater than 1 meter. Saplings smaller than that may be missed, depending on the density of vegetation in the area of interest.

Can you also classify tree species?

This service is rather about detection than about classification. However, we have developed AI models that classify trees as well. Our experience shows that only certain tree species can be classified via high spatial-resolution satellite imagery. Reach out to us at [email protected] to discuss your needs and objectives.

How often are surveys updated?

For ongoing tracking, we recommend annual or semi-annual updates, and additional surveys after major events such as wildfires or severe storms. For planning and baseline inventories, one-off surveys or monthly and bi-monthly updates can also be supported. Surveys combining recent and historical data are recommended to identify growth trends.

What information do I need to provide?

Simply sign up on the PERIOPSIS Portal and submit a new project following the guided procedure. There, you can select an area of interest (AOI) manually by drawing a polygon or by selecting a predefined polygon, in case you represent a regional authority. We handle your personal information with the highest standards of security and privacy, in full compliance with the GDPR.

What outputs do you provide?

Results include maps, summary tables with tree counts, canopy areas and density metrics. Outputs are delivered as interactive maps, dashboards and analytics via our portal. Other formats such as georeferenced vector files (e.g., GeoJSON, shapefile) are also available upon request.

Can I use my own satellite imagery?

Yes, it is possible. Please contact us first at [email protected] so we can review your data. If you have imagery meeting our resolution and metadata requirements, we can run our models on it.

Do you support my region?

We currently fully support Cyprus and Greece. If your region is not supported but you still want to use our services, send us an email at [email protected].

How long does it take to have results?

This ranges between 15 and 30 days, depending on area size and weather (i.e., cloud) conditions.